
Runs and logs
Test an automation from the Run panel, then find every run, its payload and a step-by-step trace in the Activity tab.
Every time an automation starts, Buni.ai records a run: what started it, the payload it received, each node it passed through and how it ended. You test runs from the Run panel on the canvas and review all runs, test and production, in the project's Activity tab.
Test a run from the canvas
Open the Run panel
Select Run in the canvas header. The first click opens the Automation Payload panel at the bottom of the canvas.
Fill in the payload
Use the UI Form tab to fill in fields, or Raw JSON to paste a payload. If the trigger has a payload schema, Required Schema Fields lists each field and flags any that are missing.
Under Request Settings:
- Event defaults to the trigger key. Leave it blank to use that default.
- Environment is Staging (your draft) or Production (the published version).
Run it
Select Run in the panel. When the run finishes, Step Trace lists each node with its status.
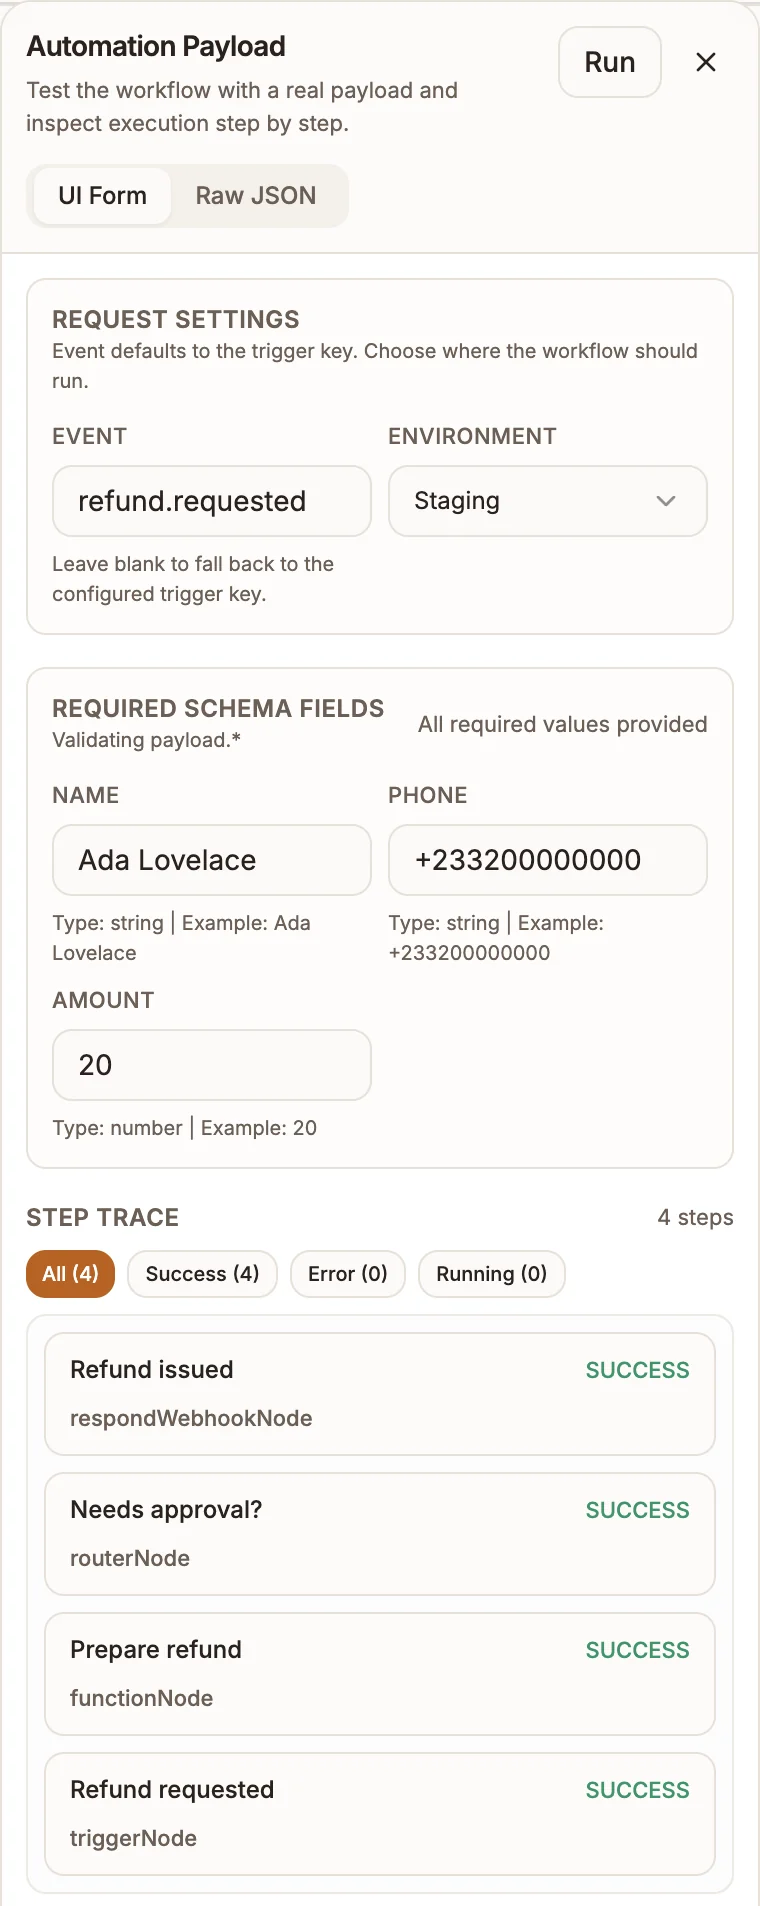
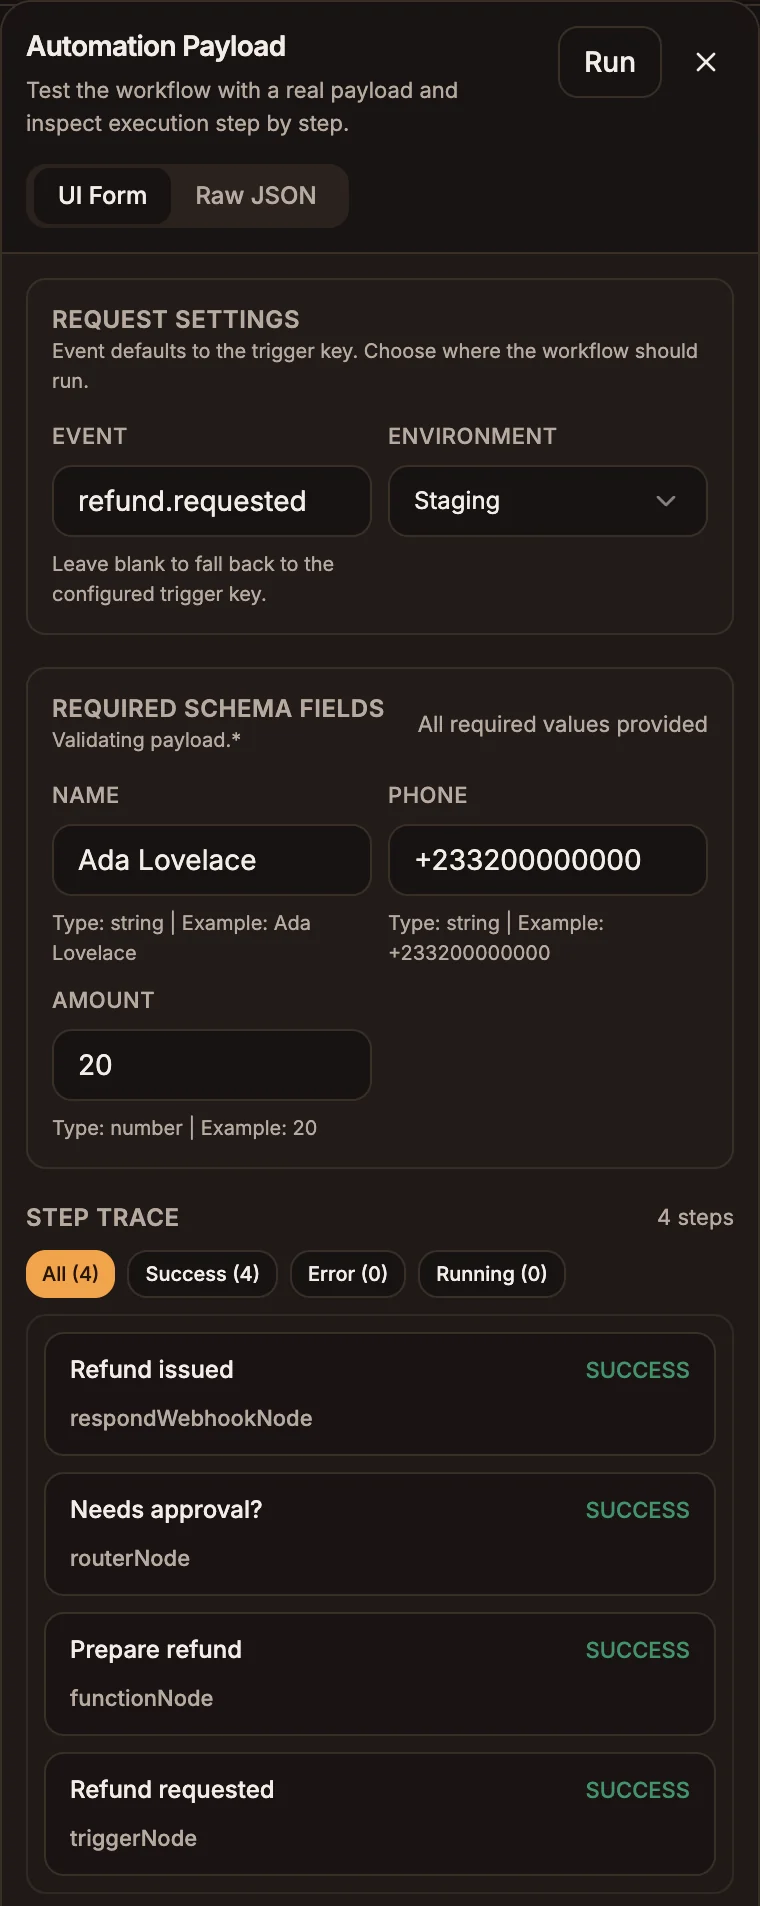
In Step Trace:
- Filter by All, Success, Error or Running.
- Select a step to jump to that node on the canvas.
- Select View Output to see exactly what the node returned.
- Long traces show the latest 25 steps. Select Show all to see every step.
Find runs in the Activity tab
Open the project's Activity tab to see every run of the workflow, from any trigger and either environment.
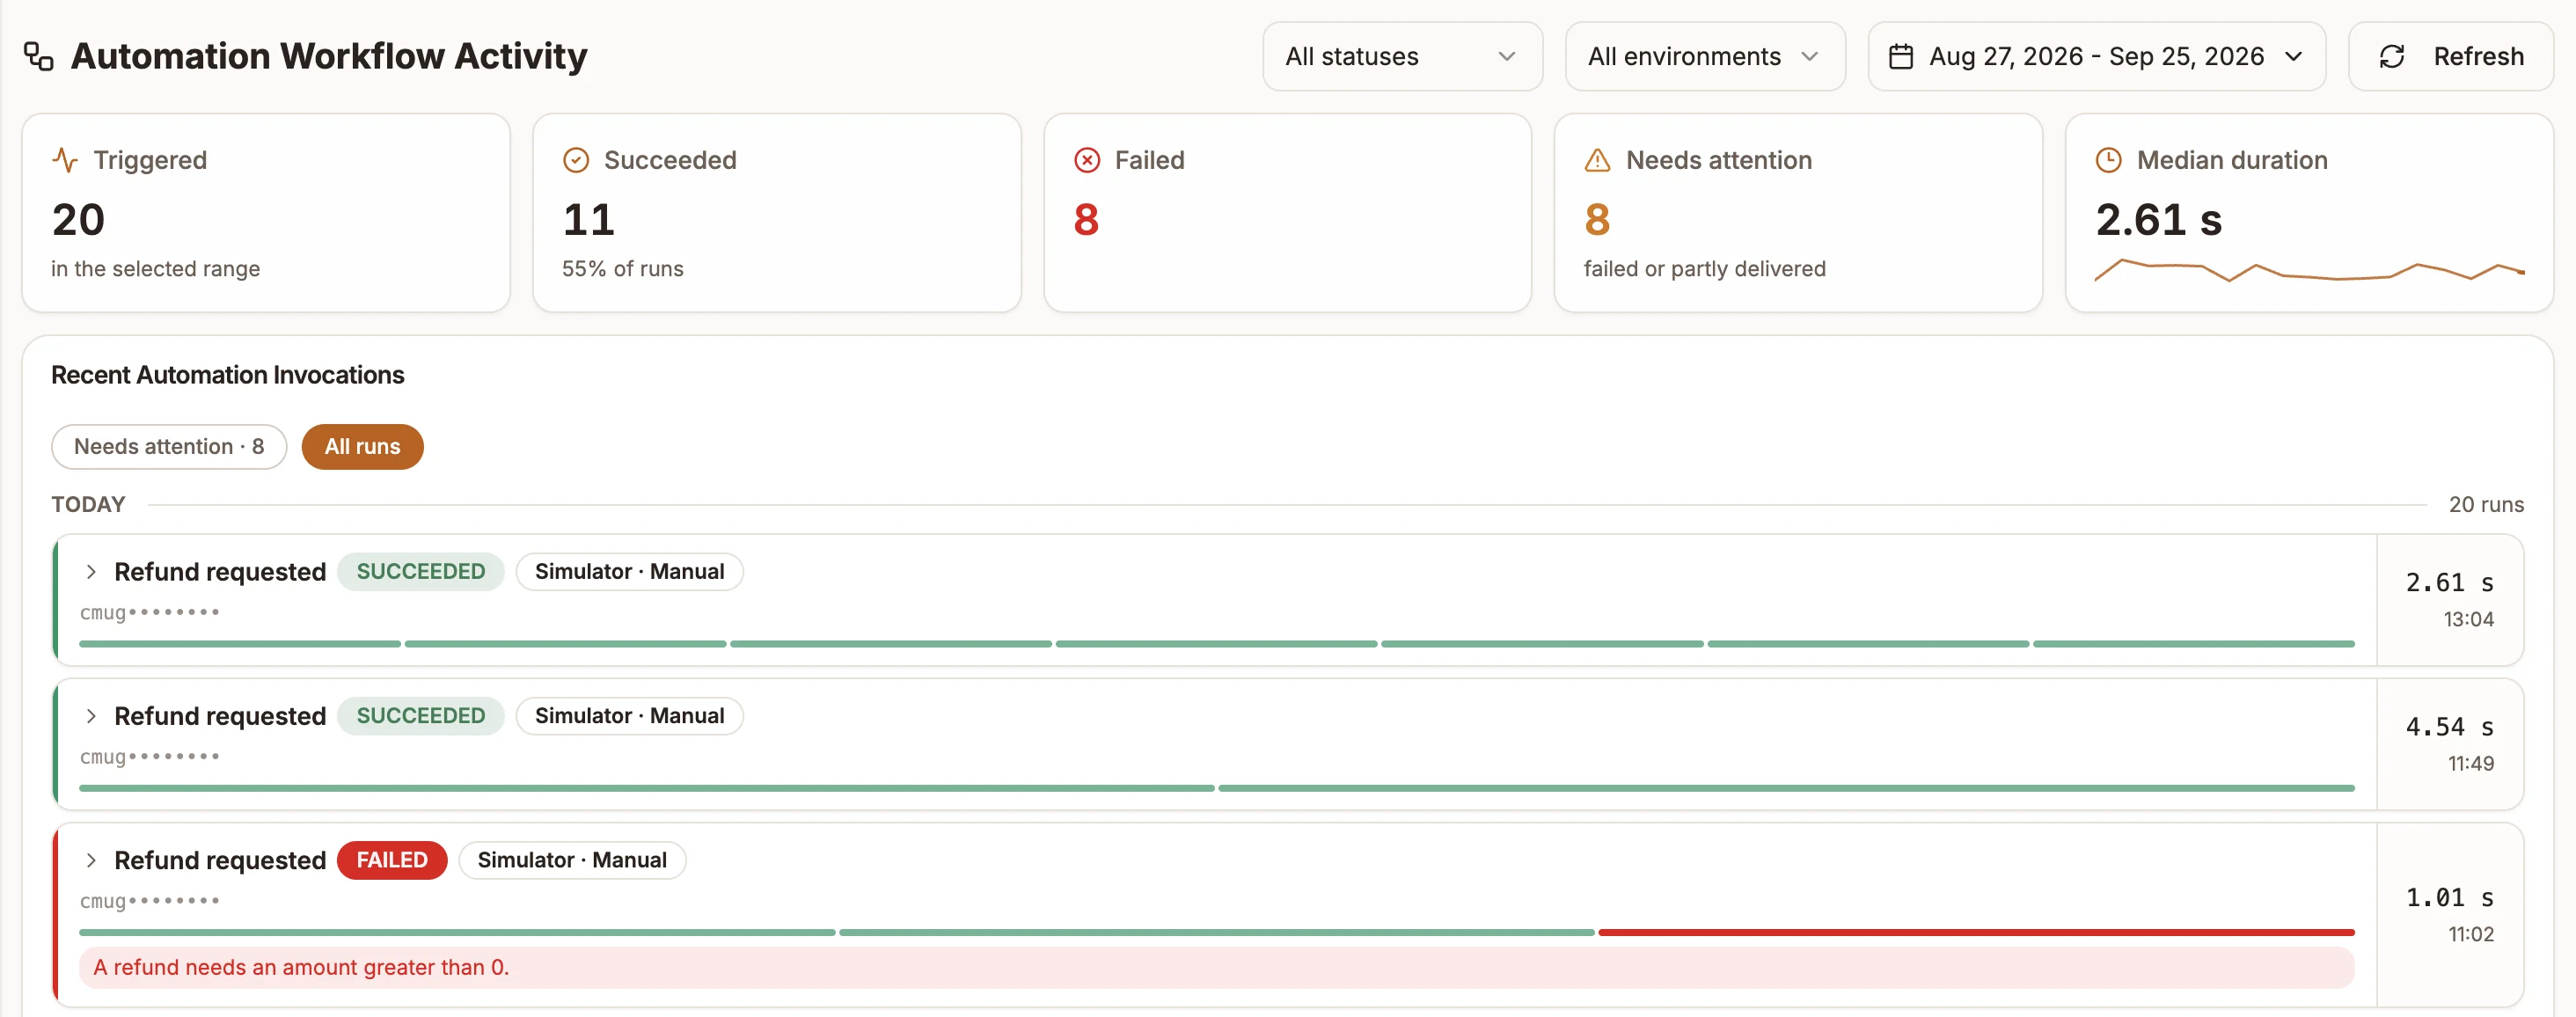
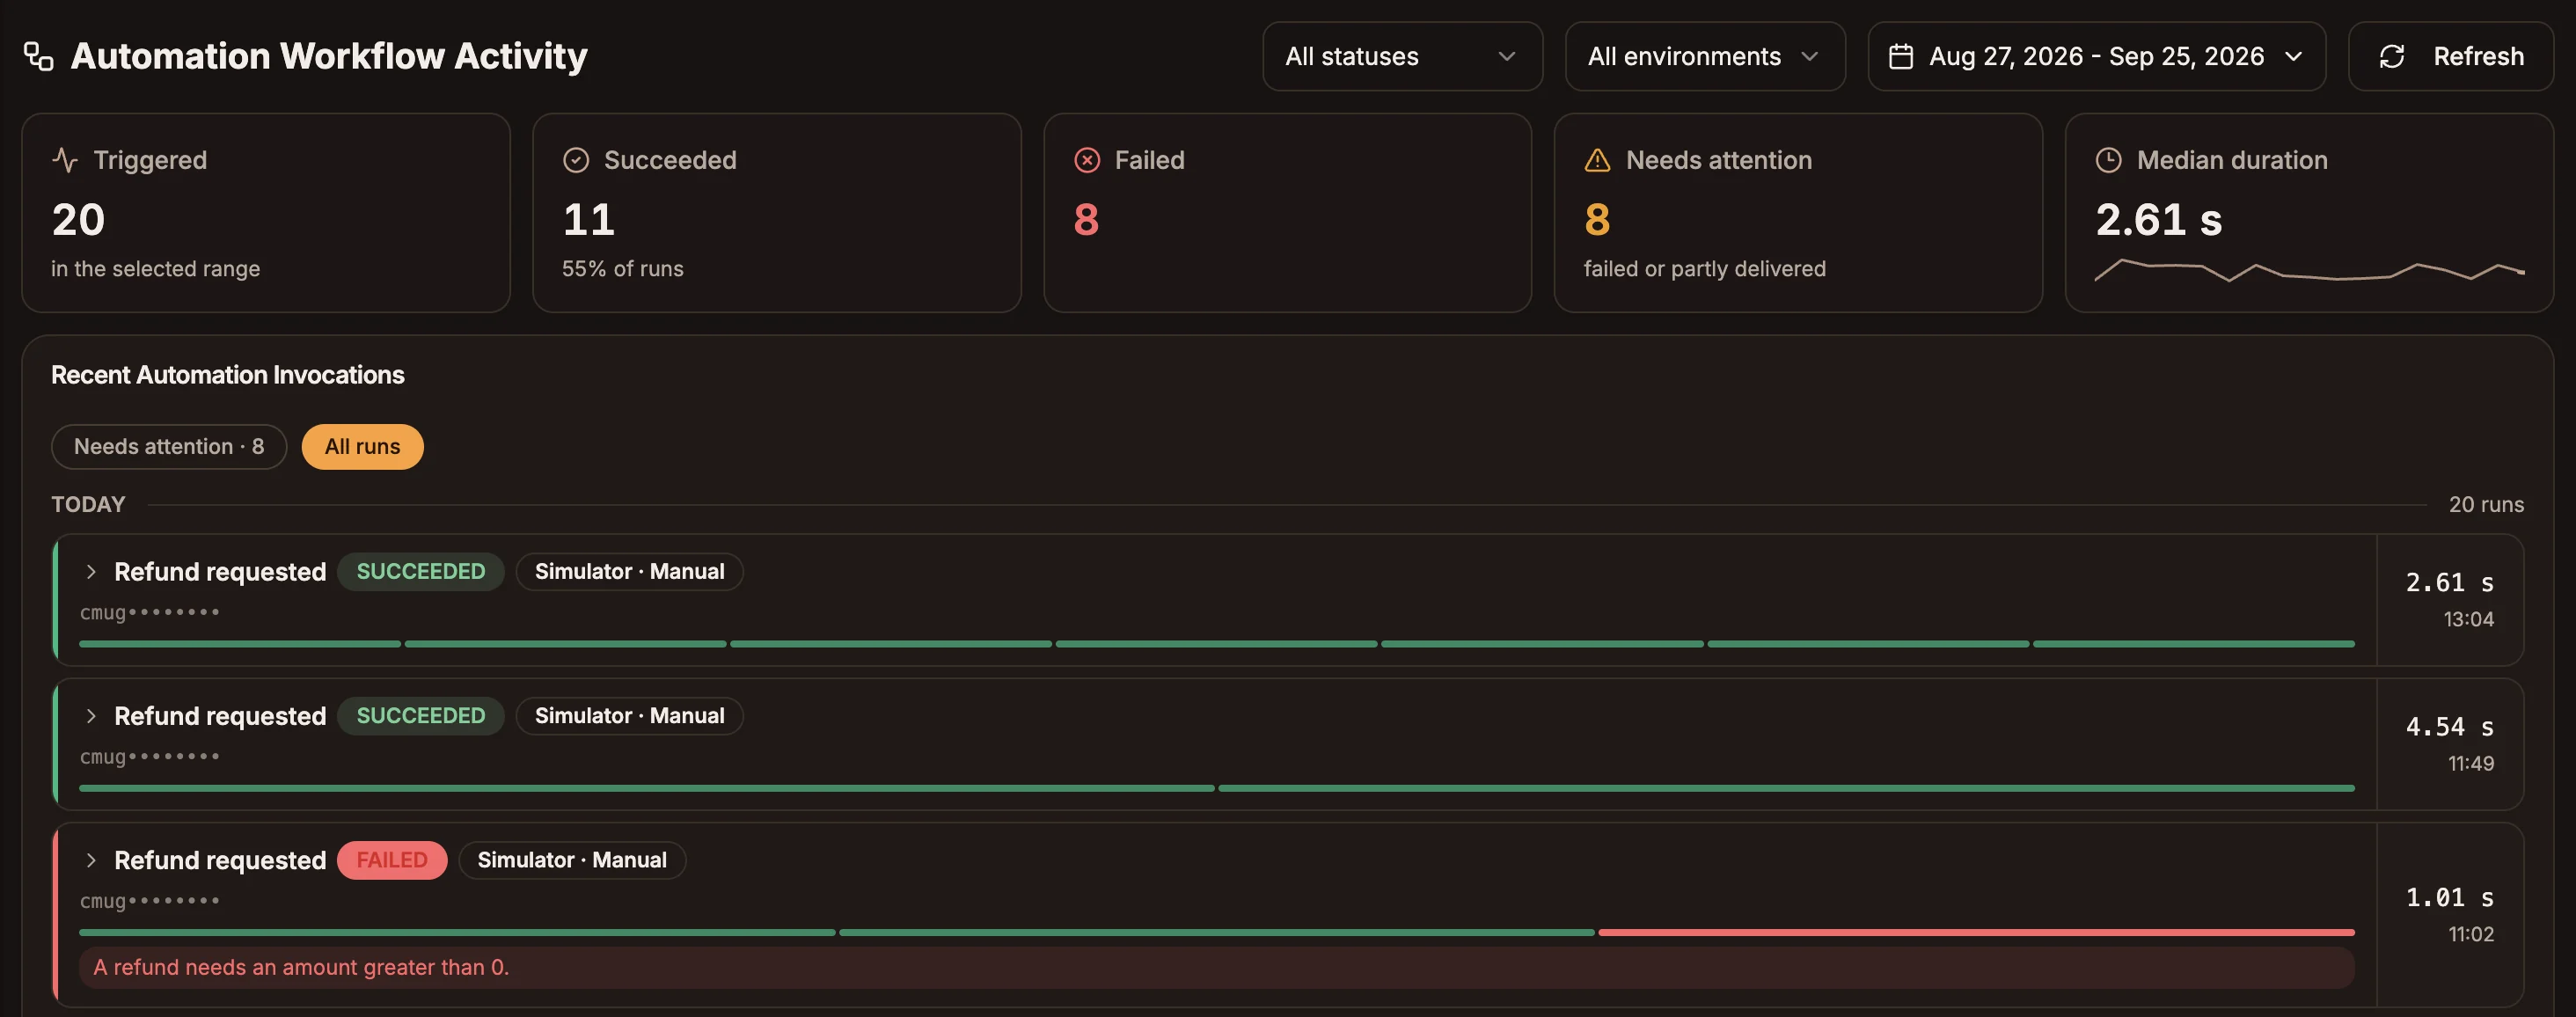
The summary cards across the top show Triggered, Succeeded, Failed, Needs attention and Median duration for the selected period. Below them, Recent Automation Invocations lists each run, named after its trigger key, with its trigger (Schedule, Webhook, Form or Manual) and environment (Simulator or Production).
Filter the list by status, by environment and by date range. Select Needs attention to see only failed, timed-out and partly failed runs.
Run statuses
| Status | Meaning |
|---|---|
| Queued | Accepted and waiting to start. |
| Scheduled | Set to start at a future time. |
| Running | Currently executing. |
| Waiting | Paused by a Wait or Approval node. It resumes on its own, or when someone decides. The run's badge reads SUSPENDED. |
| Succeeded | Finished without an error. |
| Failed | A node failed and the run stopped. |
| Timeout | The run took longer than it is allowed to. Counted with failed runs. |
| Cancelled | A scheduled run was cancelled before it started. |
Run details
Open a run to see:
| Section | Shows |
|---|---|
| Execution Summary | Status, timing, and Scheduled For or Resumes At for runs that have not finished. |
| Approval | For a run paused at an Approval node: the message and Approve / Reject buttons, or the decision once made. See Approvals. |
| Callbacks | Callback attempts, if the run was set to report back to a callback URL. |
| Workflow Steps | The nodes the run passed through, in order. |
| Request Payload | The input the trigger delivered. |
| Result Payload | What the run returned. |
| Execution Trace | The full per-node trace, including errors. |
For a run that has not started yet, Reschedule moves it to a new date and time or delays it by a number of seconds, and Cancel Schedule cancels it.
The Logs tab
The Logs tab is the project's raw event log. Search it with Search logs... and expand an event to see its properties and context. For automations, the Activity tab is usually the better place to start, because it groups everything by run.